Build assembly language development environment under Windows 10
Foreword
This semester school has arranged the assembly language course, and you need to build your own assembly language development environment. Hereby write down this article to record the construction process.
I have also found a lot of tutorials on setting up an assembly language development environment, but I am still at a loss after reading it.After I have explored, and combined with online tutorials, I want to write this easy-to-understand article.
Ready to work
1. Download DOSBox
Tool introduction: DOSBox is a DOS simulation program. Because it uses the SDL library, it can be easily ported to other platforms. At present, DOSBox has been supported on Windows, Linux, Mac OS X, BeOS, palmOS, Android, webOS , OS/2 and other systems. Many games under DOS can be run directly on this platform.
Tool official website:
Project homepage:
Download link 1 (32-bit):
Download link 2 (this is what I downloaded, it may be faster):
2. Download the assembly toolkit
Download link:
Screenshot of assembly tool
Installation tutorial
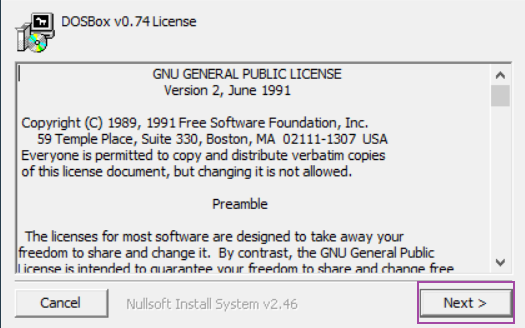
1. Install DOSBox
Double-click to run the DOSBox installer

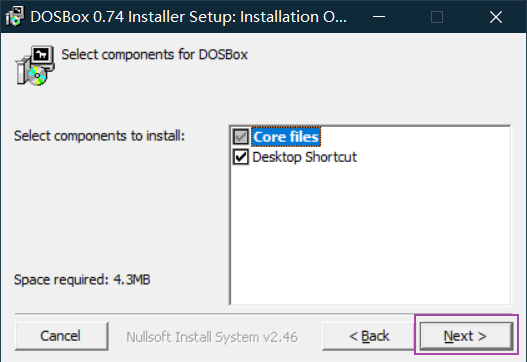
Click next
Click next
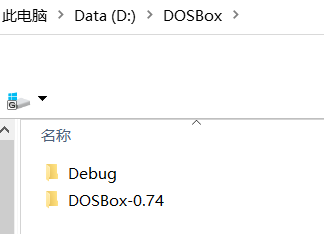
Select the installation location (I choose D:\DOSBox) and click install
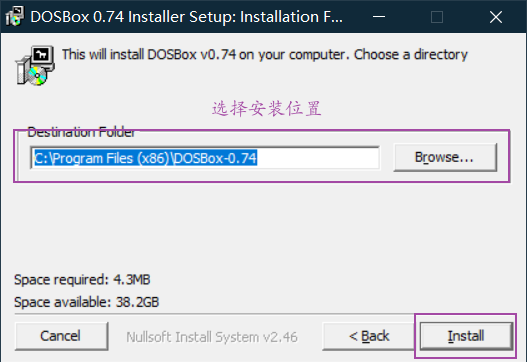
Remember the installation location and use it later
2. Create a working directory
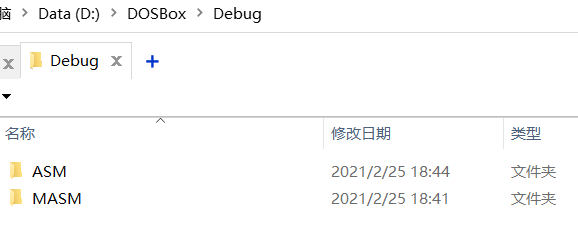
After installation, create a working directory (directory location and directory name can be customized)
Mine is in D:/DOSBox/Debug
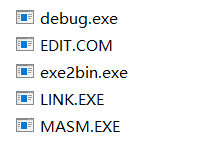
Then create two folders ASM (put your own assembler) and MASM (put assembly tool) under Debug
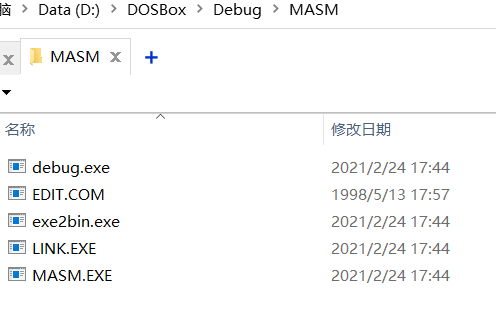
Put the assembly tool into the MASM folder
3. Mount the working directory
Open the DOSBox installation directory (mine is in D:\DOSBox)
After opening, find the batch file DOSBox 0.74 Options.bat
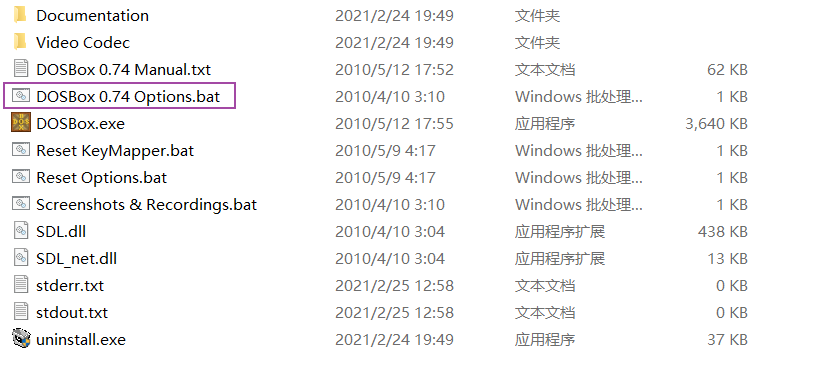
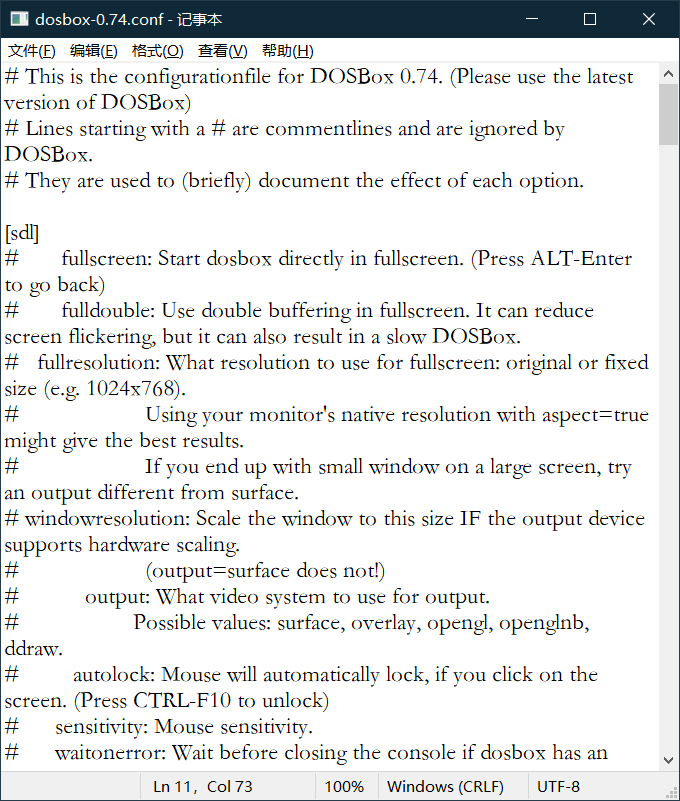
Just double-click to run it and a notepad will appear
Use the shortcut key Ctrl+F to find the [autoexec] part (usually at the end of the file)
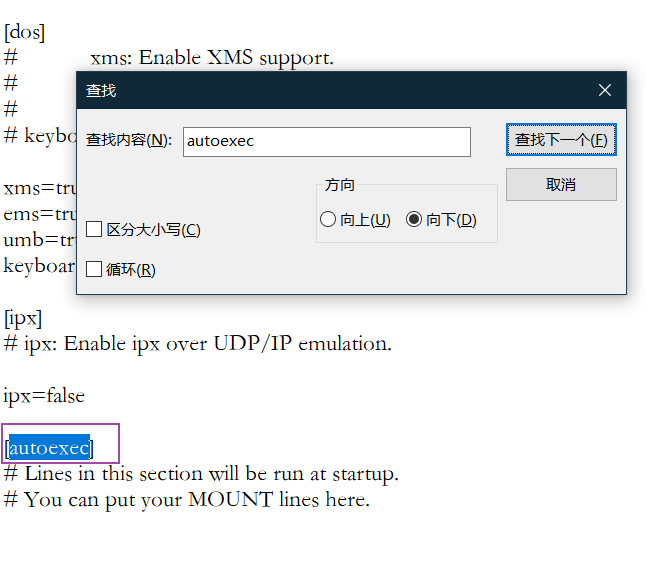
Add the following content to the file and save
MOUNT F D:\DOSBox\Debug |

Command explanation:
#Mount the working directory to the virtual drive letter F (the virtual drive letter can be customized, and the command is not case sensitive) |
If you don’t add ‘cls’, it will be like this when you open it

With ‘cls’, it will be like this when opened (I think it is more beautiful, according to personal preference)

Note: Without this configuration, you need to manually enter the above command every time you open DOSBox, which is very troublesome
Instructions for use
DOSBox commonly used shortcut keys
| Shortcut key | Function |
|---|---|
| Alt+Enter | Toggle full screen |
| Ctr+F1 | Change keyboard mapping |
| Alt+Pause | Pause simulation |
| Ctrl+Alt+F5 | Start/Stop video recording |
| Ctrl+F4 | Exchange the mounted disk image, that is, update the disk file |
| Ctrl+F5 | Screenshot |
| Ctrl+F6 | Start/Stop recording sound |
| Ctrl+F7 | Reduce frame skipping |
| Ctrl+F8 | Increase frame skip |
| Ctrl+F9 | Close DOSBOX |
| Ctrl+F10 | Capture/Release the mouse |
| Ctrl+F11 | Simulate deceleration |
| Ctrl+F12 | Speed up simulation |
| Alt+F12 | Do not lock the speed |
Note: I have not tested all of the above shortcut keys. For more detailed information, see README.txt (in the Documentation in the DOSBox installation directory)

Adjust the window size
The initial interface is very small, and the interface cannot be stretched directly, so if you need it, you can adjust it according to the following method
Double click to open DOSBox 0.74 Options.bat
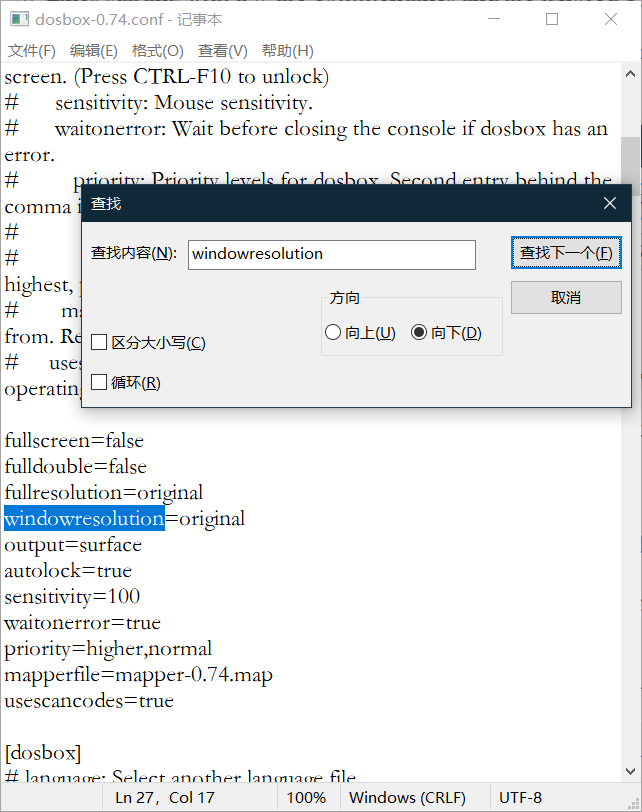
Use the shortcut key Ctrl+F to find the windowresolution field
will
windowresolution=original |
To
windowresolution=800x500 #800x500 is a custom size and can be modified |
Note: No need to delete the original sentence, just add # in front of the comment.

After saving, restart DOSBox to take effect
Create and edit files
Regarding creating and editing files, if your working directory (mounting directory) has an EDIT.COM file (in the assembly toolkit I provided), then you can create and edit the file in DOSBox. If not, please use me The provided toolkit or look down patiently.
Use DOSBox to create and edit files (not recommended)
Open DOSBox and use the following commands to create and edit the test.asm file
edit test.asm |
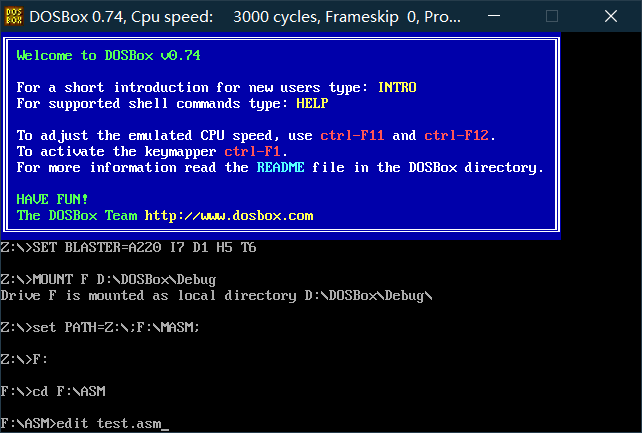
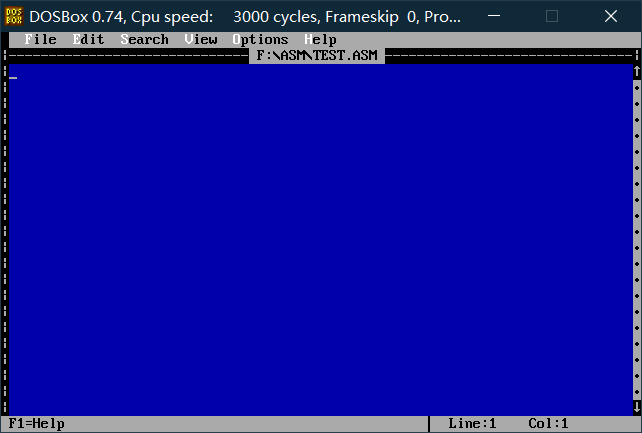
Press Enter and enter the following interface to edit (note: the mouse arrow can only be active in the editor, if you want to exit the mouse, you can use the Ctrl+F10 key combination to exit)
Use Notepad to create and edit files (other editors are also available)
Create the test.asm file in this way below
Create a new text document, copy the following code into it and save
datas segment |

Rename it to test.asm afterwards
Compile and debug
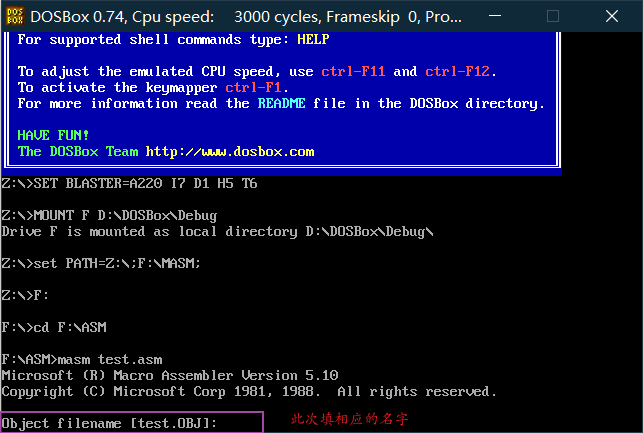
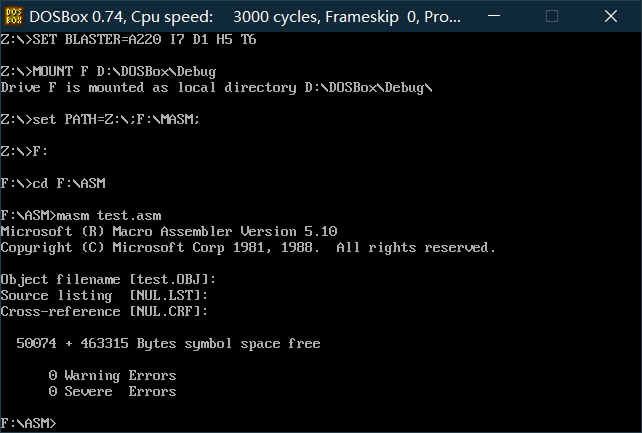
Open DOSBox and enter the following command
masm test.asm |
After you press Enter, you will be asked for the file name, and it is recommended to press Enter directly
The compiler prompts to enter the name of the cross-reference file. This file is the same as the list file. It is an intermediate result produced by the compiler in the process of compiling the source program into the target file. You can let the compiler not generate this file, just press the Enter key.
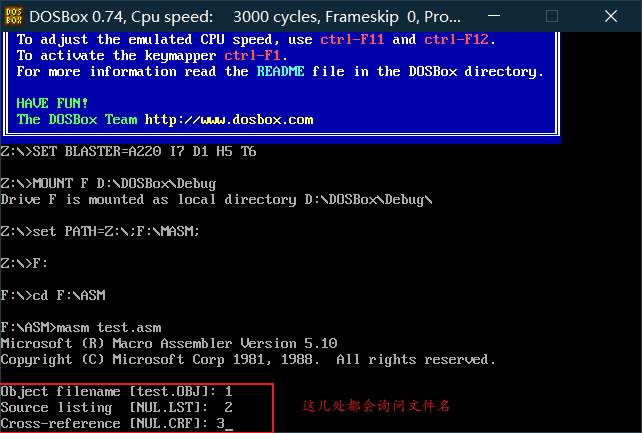
You can enter the file name separately like the above picture, and open ASM to view the following
This article is all by default, that is, press Enter without entering the file name separately
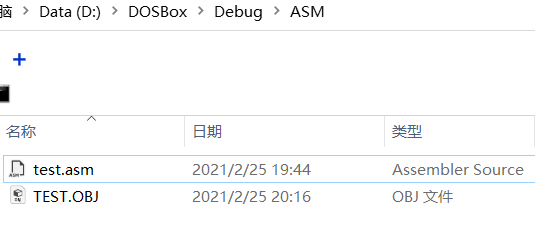
Open the ASM folder and view as follows
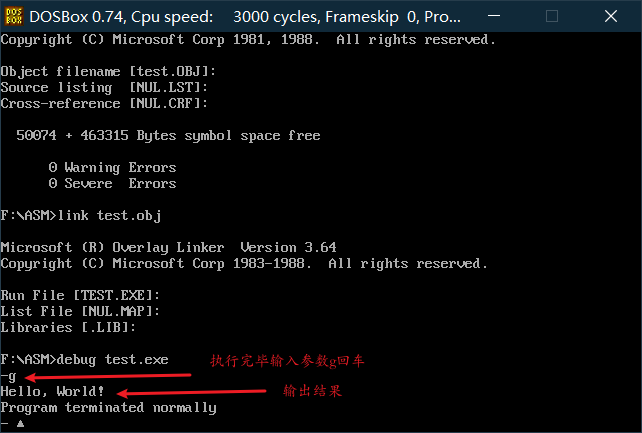
Continue to enter the command
link test.obj |

After running, check the ASM folder
Continue to execute the following commands
debug test.exe |
Simple use of debug
debug is a debugging tool for real mode (8086 mode) programs provided by Dos and Windows
- You can view the contents of various registers of the CPU
- You can check the status of the memory
- Can track the operation of the program at the machine code level
| Command | Function |
|---|---|
| R command | View and change the contents of CPU registers |
| D command | View the contents of the memory (in the form of machine instructions) (displayed in hexadecimal) |
| E command | Rewrite the content in the memory, that is, provide instructions (using machine instructions), which are used less, mostly A commands |
| U command | View the contents of the memory (convert the form of machine instructions to the form of assembly instructions) (decompilation) |
| T command | Execute an assembly (machine) instruction (that is, execute the instruction in the current instruction buffer) |
| A command | Compared with E, write a machine instruction in the memory in the form of assembly instruction |
| P command | When the assembly instruction is int xx, use the p instruction to end (otherwise the CPU will point to an unknown address segment) |
| G command | After executing the exe run result display |
| Q command | Exit debug |
| ? Command | View command help |
R command
View the contents of CPU registers

| Tag name | set | reset |
|---|---|---|
| Overflow (whether) | OV | NV |
| To Direction (decrease/increase) | DN | UP |
| Interrupt (allow/mask) | EI | DI |
| Sign (negative positive) | NG | PL |
| Zero (yes) | ZR | NZ |
| Auxiliary Carry (yes) | AC | NA |
| Parity (even odd) | PE | PO |
| Carry Carry (whether) | CY | NC |
Change the content of the CPU register
Change the value of the register
If you want to modify the value in a register, such as the value in AX, you can add the register name after the R command, enter “r ax” and press the Enter key, and “:” will appear as an input prompt. Enter the value to be written later After the data, press the Enter key (press Enter directly to exit the modification), that is, the modification of the content in AX is completed. If you want to see the modified result, you can use the R command to view it again (there is no need between the R command and the register name). Spaces)
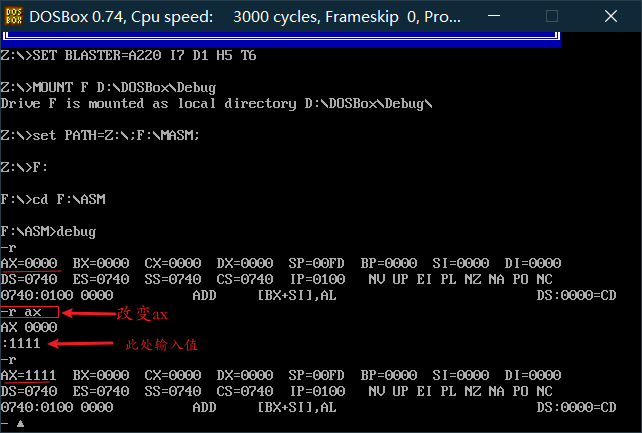
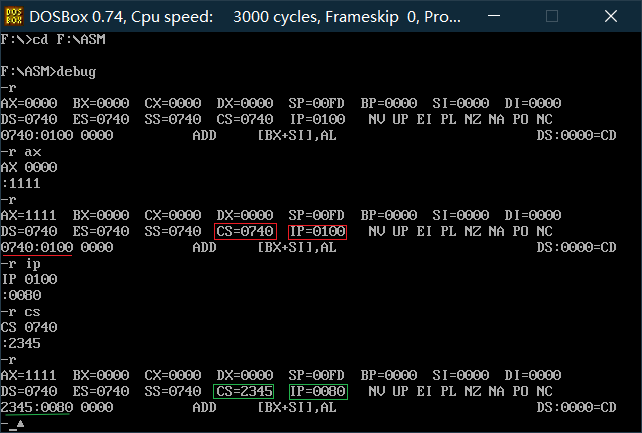
Change the value of CS:IP
Change the value of the flag
rf |

D command
Using the D command, you can view the contents of the memory, and debug will output 3 parts:
- The middle is the content of 128 memory cells starting from the specified address, output in hexadecimal format, the output of each line starts from the address of an integer multiple of 16, and the content of up to 16 cells is output. Note that in each line There is a “-“ in the middle, which divides the output of each line into two parts, so that it is easy to view
- On the left is the starting address of each line
- On the right are the displayable ASCII characters corresponding to the data in each memory unit. If there is no corresponding displayable ASCII character, debug will use “.” instead

Note that the content of the memory we see is different in different computers, and it may be used every time
Debug sees different content, because what we see with Debug is the content that was originally in the memory, which is affected by the system environment that may change at any time. Of course, we can also change the memory and registers Content in
After entering the debug, use the D command to view it directly, and the content at the address preset by the debug will be listed

Use d segment address: offset address view (take d 1000:0 as an example)
Format: d segment address: offset address |

After using “d segment address: offset address”, then use the D command to list the subsequent content

You can also specify the viewing range of the D command. At this time, use the format of “d segment address: start offset address end offset address”

If the input address is not a multiple of 16, the output effect is like this

E command
Rewrite the contents of the memory, but in the form of machine instructions
Write the contents of the memory unit 1000:0-1000:9 as 0, 1, 2, 3…., 9, and you can use the format of “e segment address: starting address data data data $\cdots $” To proceed

Use the E command to modify the contents of the memory unit starting from a certain address one by one by asking questions

- The red part is the modified data entered by the user. When it reaches a certain memory unit, you can choose to modify (enter the value to be modified) or not to modify (press the space directly). After processing a memory unit, press the space To continue processing the next memory unit; after all processing is complete, press enter
You can use the E command to write characters to the memory

You can also use the E command to write a string to the memory

U command
For the machine code disassembly display, the display output of the U command is divided into 3 parts, the address of each machine instruction, the machine instruction, and the assembly instruction corresponding to the machine instruction
Disassemble by address
u address |
The command starts from the specified address and disassembles 32 bytes. If the address is omitted, 32 bytes are displayed starting from the next unit of the last instruction of the previous U command


Disassemble by range
u range |
T command
Command format
T [=address] [number of instructions] |

Use the T command to execute the command pointed to by CS:IP
First use the E command to write 8 bytes of machine code to the memory unit starting from 1000:0
e 1000:0 b8 01 00 b9 02 00 01 c8 |
| Machine code | Corresponding assembly instructions |
|---|---|
| b80100 | mov ax,0001 |
| b90200 | mov cx,0002 |
| 01c8 | add ax,cx |

Then use the R command to view the status of the registers in the CPU, you can see that CS=0740H, IP=0100H, pointing to memory 0740:0100

If you want to use the T command to control the CPU to execute the instructions we wrote to 1000:0, you must first make CS:IP point to 1000:0; then use the R command to modify the contents of CS and IP so that CS:IP points to 1000:0

After completing the above steps, we can use the T command to execute the instructions we wrote (at this time, CS:IP points to the memory unit where our instructions are located). After executing the T command, the CPU executes the instructions pointed to by CS:IP, Then the instruction b8 01 00 (mov ax, 0001) at 1000:0 is executed. After the instruction is executed, Debug displays the status of the register in the output CPU

Note: After the instruction is executed, the content in AX is rewritten to 1, IP is changed to IP+3 (because the instruction length of mov ax,0001 is 3 bytes), CS:IP points to the next instruction
Continue to use the T command to execute the following instructions

Use the T command to continue to execute the following instructions, pay attention to the changes in the contents of the CPU related registers after each instruction is executed
A command
It is inconvenient to use the E command to write machine instructions. It is best to write the instructions directly in the form of assembly instructions. For this reason, Debug provides the A command, and the A command writes the machine instructions in the memory in the form of assembly instructions.
First use the A command to write a few instructions to the memory unit starting from 1000:0 in assembly language, and then use the D command to view the execution result of the A command

It can be seen that when using the A command to write instructions, we input assembly instructions. Debug translates these assembly instructions into corresponding machine instructions and writes their machine code to memory.
When using the A command to write assembly instructions, directly press the Enter key after the given start address to indicate the end of the operation
If the A command is not followed by an address, input the command from the preset address

? Command
Type? to see more commands

The results are as follows: